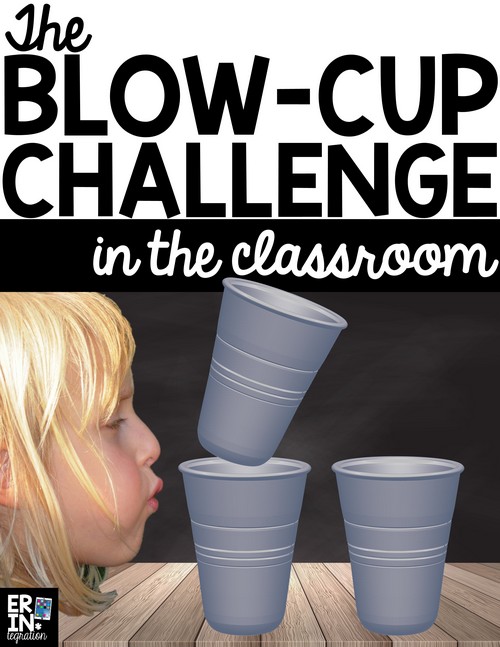
The Blow Cup Challenge is a newly popular trick made famous on Twitter and YouTube. In the Blow Cup Challenge, you set two cups on a flat surface, place a third cup into the first and try to blow it into the second cup. Just like bottle flipping, the blow cup challenge is easy to set up, has a bit of a learning curve, and can be strangely satisfying when you “win.”
Naturally, kids are obsessed. I’m sharing a way to harness that excitement by bringing the blow cup challenge into the classroom with science and math explorations.
So, What Exactly is the Blow Cup Challenge?
Here is a quick demo video I made that shows what it looks like and how to do it:
I created a Blow Cup Challenge STEM Project available here on www.shoperintegration.com that includes everything you see in this post and more.
Set up the Blow Cup Challenge in the Classroom:
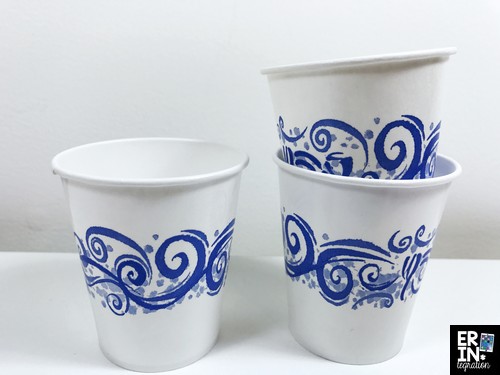
To set up the blow-cup challenge in the classroom, you will need a variety of cups and water. We tested 4 different cups. Little plastic cups, paper cups, large solo-type plastic cups, Styrofoam cups and paper coffee cups all work great. If you are doing the test in elementary, a smaller cup will have a higher success rate since those little lungs are limited in how much air they can push!
The main focus of this challenge is for students to learn the different kinds of variables and how they interact (or don’t!) in an experiment. For older students, you could easily adapt this into a more traditional lab too.
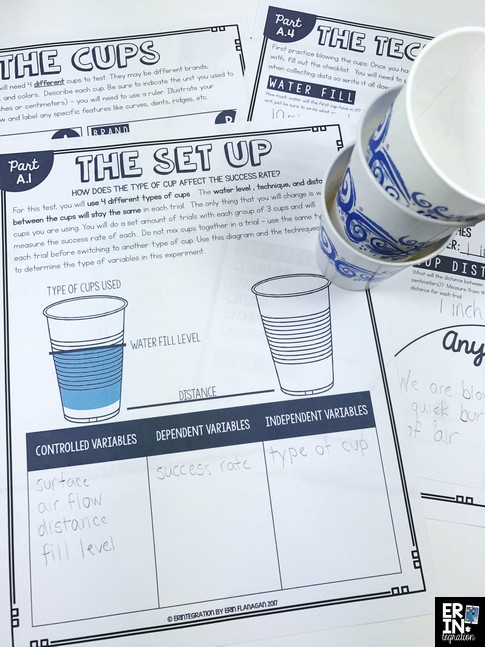
- type of cup
- water level
- distance between cups
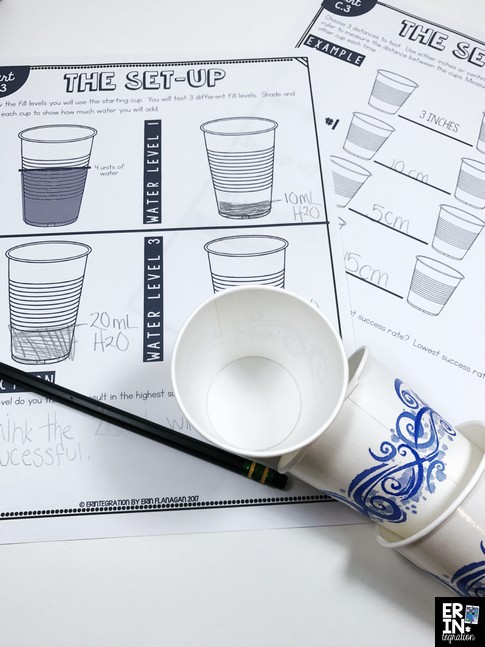
I leave details like how many trials, units of measurement, which cups, how much water, and the distance open for students to select to keep the project flexible for all learners.
You could have students choose or simply fill in the parameters for students to test before copying the packet.
Collecting Data During the Blow Cup Challenge
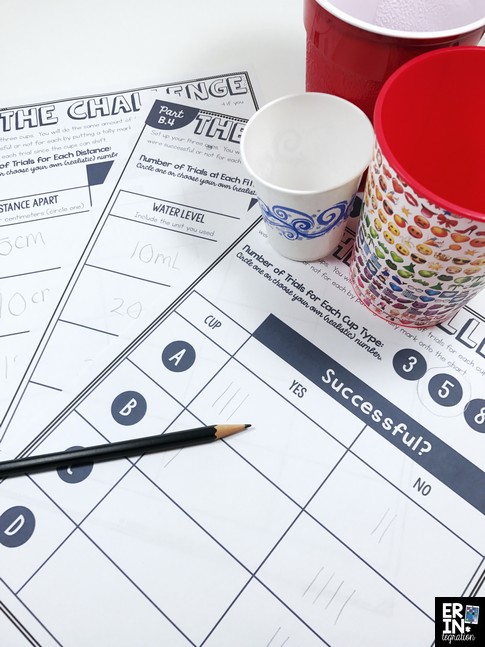
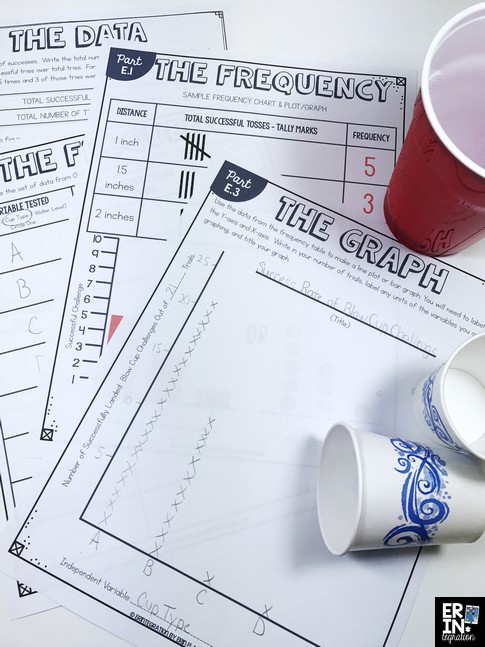
In the interest of time, I limited students to 5 trials per set up. You could also split the 3 challenges among 3 groups and have them all share data at the end. Students then complete their challenge 5 times at each set up and record tallies if they “made it” or not.
We then share all of our data and filled in a class chart. We discussed how more trials helps us get a better picture of the results.
Students choose one set of data to create frequency table and line plot.
They had to title and label their plot too. I included math anchor charts to guide them since some of the math is more advanced than what we do. I had them use calculators for example to convert their success rate from a fraction into a percent.
Critical Thinking and the Blow Cup Challenge
Students answered reflection questions that had them look at their data to determine which cup type, water level and distance yield the highest success rate. But it would not be science without some critical thinking, so I included questions that had students thinking about other variables that might have affected their results. For example, they might think they used the same technique and air flow each time but that is tough to know.
Students use their reflection to design and label an ideal set up. I was super impressed that a student drew a hair dryer as a way to control the air flow. Another was inspired by a K’NEX bottle-flipping robot to draw a robot that would blow a continuous stream of air from the exact same height and direction each time. Another wrote that they would use fresh cups each time since they noticed the cup was harder to move when it started getting more and more wet.
That kind of critical thinking can be hard to tease out, but students were so engaged they wanted to take the time to ponder and discuss these open-ended questions!
Integrating Technology into the Blow Cup Challenge
Finally we used all of our learning to create a slow motion video of a successful blow cup challenge! Since we had practice and knew which cups, how much water, and the best distance, all students were able to create one. The slow motion video helps us visualize the science behind the blow-cup challenge. I created a mini-anchor chart with a kid-friendly explanation too!
To create the slow motion video, students filmed with the iPad camera then put their clip into iMovie to slow it down. We saved our slow-mo video then uploaded it into iMovie again to slow it down even more!
Likewise, you can also create a fast motion clip of the “bloopers” and misses. To do that we clipped the misses apart from the success. We slowed down the success and then sped up the misses all in iMovie. Since I’m a grown up and obviously not successful with these trendy kid-challenges, students got a kick out of my super fast mess up reel, which I told them was a great illustration of growth mindset!

