
Get students to collaborate together to create an interactive infographic on Wakelet! The mood board layout on Wakelet is ideal for creating shared visual collections.
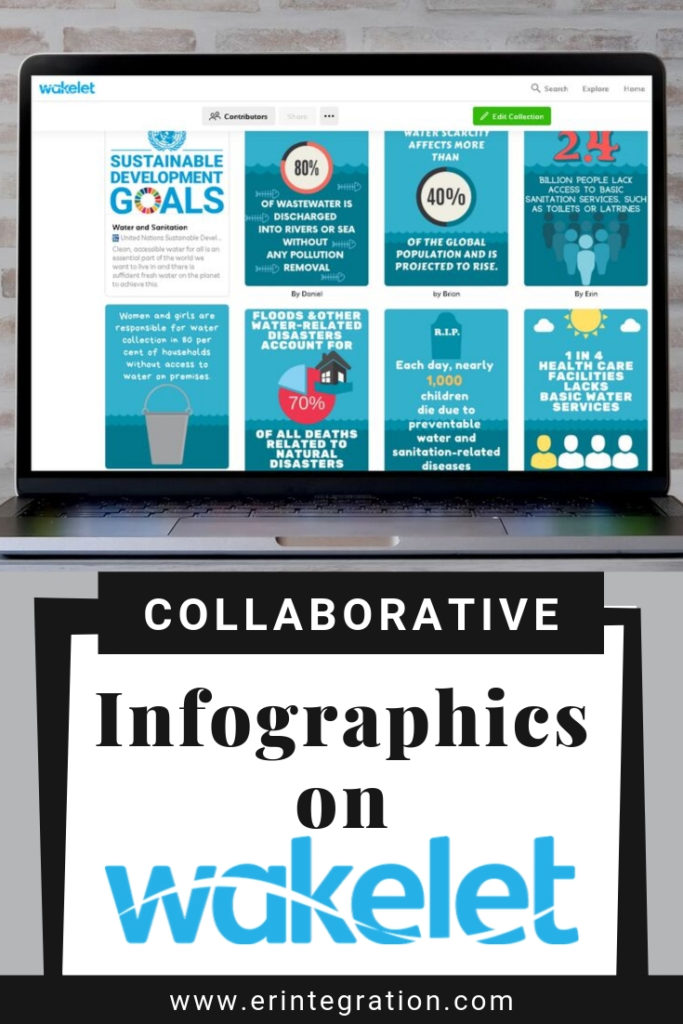
Students can work in teams to present content area information at a glance with this project based learning activity and be sure to get your free infographic rubric at the end of this post!
The Mood Board Layout on Wakelet
Wakelet recently released the “mood board” view as an option to display a collection in a tiled, dynamic, grid. I shared 18 ways teachers and students can use digital mood boards on Wakelet in a previous post and I got some questions about what the heck an interactive, group infographic is and how to make one, so here we are.
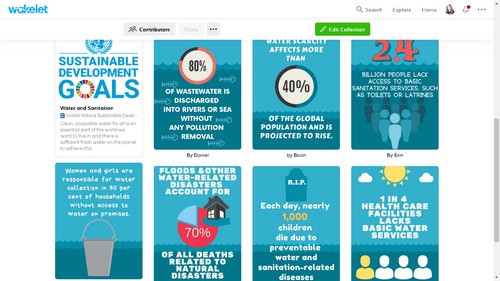
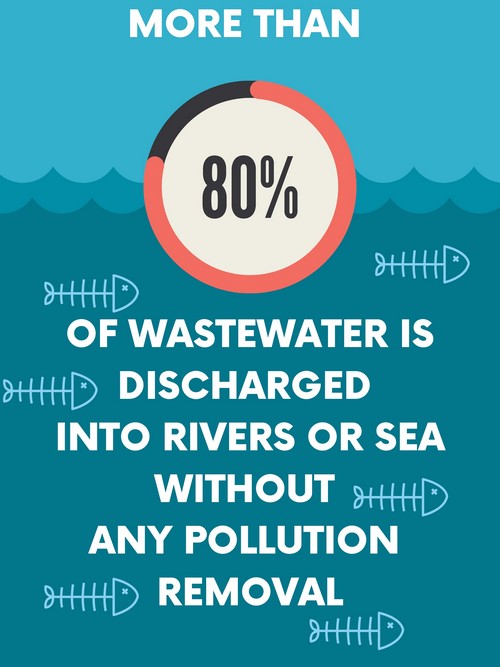
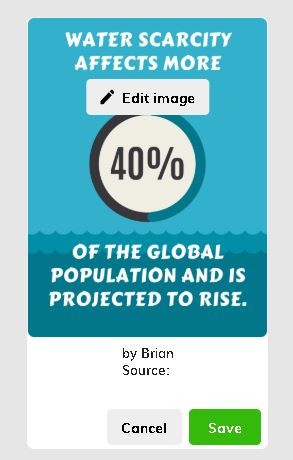
Each individual piece of content become part of the overall infographic.
This example shows information about the UN Sustainable Development Goal #6.
Click to view my infographic on Wakelet sample that I created to demonstrate the idea.
If you are new to Wakelet, Wakelet is a free platform that can be used to curate and organize content into a public or private collection. Collections can be easily shared with anyone and accessed both on the website and using the iOS app or Android app. Wakelet can be used in the classroom to create newsletters, as a backchannel, to create easy escape rooms, and more.
Sign up & grab the educators guide to get started and you can click here to directly view my public Wakelet page with all of my free templates, too.
Using Infographics in the Classroom
An infographic is a visual image such as a chart or diagram used to represent information or data. The goal of an infographic is to share information quickly and clearly. Infographics can be used to help viewers glean information and trends about a topic. Kathy Schrock has a page with a wealth of info about infographics on her blog.
Infographics typically have a very clean style to aid viewers in reading and understanding. Text, icons, and specific color choices are all used along with pie charts, graphs, fractions, and other charts to organize and present data. Many digital tools exist for creating infographics, but these are often single user and the output is a single image.
Creating Infographics on Wakelet
Students will work in teams to create an interactive infographic on Wakelet. Teams should each have one topic that they will research and create the infographic about.
Students should organize their research into a list of important facts that will help the viewer get an overall sense of importance and scale of information. Facts should be chosen and organized on the infographic in such a way to display any trends or patterns they observed.
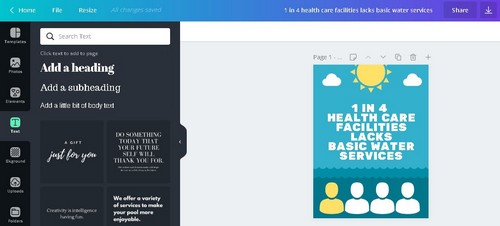
Next, students use digital tools to create a digital poster – one digital poster image for each fact. Pic Collage, Google Draw, Adobe Spark, and Canva can all be used to create the digital posters.
Students should also agree on a color palette and style for their posters for continuity.
This helps with the overall appearance of the finished infographic.
Digital posters should be kept very simple. A bit of text and a graphic along with a simple background will plenty.
Students can use various shapes to make data displays. Students can also play with font and font color to make elements pop. This is also a good time to introduce accessibility including some best practices for font choice and color contrast suggestions.
Uploading Posters to Create Infographic on Wakelet
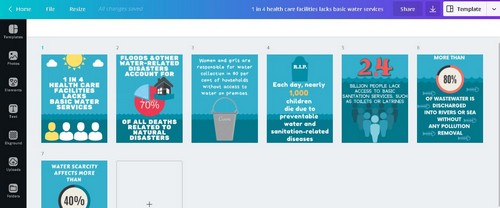
Once all posters are saved as images (JPEG works fine), students will need to upload the images to a single, shared Wakelet collection. There are several ways to accomplish this
- If students are over 13 and have account, one team member creates the Wakelet collection and invites teammates as contributors.
- If students are under 13, the teacher creates a collection for each group. The teacher then shares the collection and join code with teams.
Students can all upload their images individually to the Wakelet, or they can share the images to one location (like Google Drive) and upload them all at once. To upload images, click Edit, click the plus, then Image. Choose Upload an image then select one or more than one image to upload.

Clicking edit on each image brings up the option to add a caption – I recommend using this space for students to add their name and a citation to the pieces they created for easy assessment.
Finally, set the collection to the mood board layout for maximum impact.
Interactive Elements to Include on Wakelet Infographic
In addition to the infographic images, students can also add URLs to their sources, videos, or create Flipgrid shorts to include in the collection. These “interactive” elements should be deliberately chosen to support the goals of the infographic or help viewers learn more about the topic.
Wakelet currently supports directly embedding and/or linking to the following types of content:
- URL
- Text
- YouTube
- Tweets
- Bookmarks
- Images
- Flipgrid Video
Each item added to the collection can be clicked and dragged to set an order that looks best.
Topics & Data for Interactive Infographics on Wakelet
While infographics can be created for ANY topic, a category with multiple related topics and easy to find stats will work best in the classroom. That way teachers can easily divide the class into teams and each infographic is unique but still connected to an overall objective.
I recommended the categories and information shared on the Data.gov website to get started:
- Agriculture
- Climate
- Consumer Habits
- Ecosystems
- Education
- Energy
- Finance
- Health
- Government
- Manufacturing
- Maritime
- Ocean
- Public Safety
- Science & Research
Some content-specific categories that are already divided into topics & perfect for infographics are:
- Common Digital Citizenship Categories
- UN Sustainable Development Goals
- Careers in STEM
- Representation in STEM
- ISTE DigCitCommit
Sharing Wakelet Infographics
After students are finished creating their infographics on Wakelet, they can be easily shared by printing and displaying the QR code or linking the shortlink on a class website or through Seesaw.
Wakelet Collections can also be exported as a PDF with all of the clickable links intact! Make sure the collection is set to unlisted. Click to view the collection and click the three dots at the top.
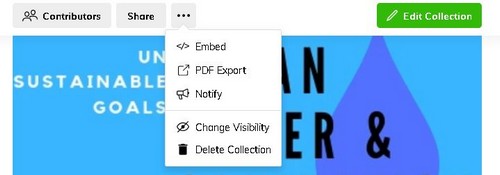
Select Export as a PDF and choose create when prompted. The PDF does not support the mood board layout, it will instead display each image separately.
Assessing Interactive Infographics on Wakelet
There are may options for assessing student infographics. I created an editable rubric on Google Sheets that you can download and tweak to fit your grade level, standards, and expectations.
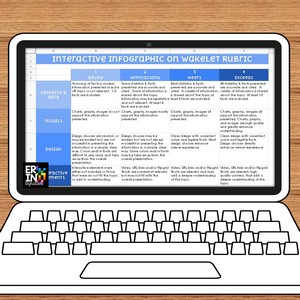
Get the Free Infographics on Wakelet Rubric and More When You Subscribe to Erintegration
As with any rubric, I think sharing it with students when assigning the project is key to making sure students know what you consider quality work. I also recommend having students develop and edit the rubric with you.
Ok, let’s see those interactive Wakelet infographics! Be sure to tag me on social media if you use any of the digital tools I mentioned to have students collaborate on an infographic on Wakelet. I’m excited to see what you and your students create!